
Mid-market finance leaders face a harsh reality: 65% of organizations lack AI-ready data and over 60% of AI projects fail to meet expectations. Automated dashboards promise faster reporting and better decisions, yet many teams struggle with fragmented systems and unreliable metrics. The difference between dashboard success and failure comes down to data governance, pragmatic implementation, and choosing solutions that fit your finance team's actual needs. This guide reveals how to leverage automated dashboards to improve accuracy, accelerate reporting cycles, and empower smarter decisions in 2026.
Table of Contents
- Challenges Finance Leaders Face With Data And AI Readiness
- How Automated Dashboards Enhance Data Accuracy And Streamline Reporting
- Unlocking Better Decision-Making With Visual KPIs And Scenario Analysis
- Practical Steps For Mid-Market Finance Teams To Successfully Implement Automated Dashboards
- Discover How Lole Works Empowers Finance Leaders With Automated Dashboards
- Frequently Asked Questions
Key takeaways
| Point | Details |
|---|---|
| Accuracy boost | Automated dashboards reduce data entry errors by up to 80% through eliminating manual reconciliation processes. |
| Speed advantage | Reporting cycles drop from weeks to hours by automating data aggregation and visualization workflows. |
| Decision power | Real-time visual KPIs and scenario analysis enable faster, more confident strategic choices for finance leaders. |
| Start small | Begin with one trusted KPI and strong governance before scaling dashboard adoption across your organization. |
| AI integration | Generative AI amplifies dashboard value when balanced with enterprise guardrails and pragmatic rollout phases. |
Challenges finance leaders face with data and AI readiness
Mid-market finance teams often invest in automation tools expecting immediate transformation, only to encounter roadblocks that undermine dashboard effectiveness. The root cause typically lies in fragmented technology ecosystems and immature data practices rather than the dashboard technology itself.
Fragmented ERP and finance systems create persistent data silos with no single source of truth, forcing teams to reconcile conflicting numbers across departments manually. When your revenue figures in Salesforce don't match your accounting system, and your operational metrics live in disconnected spreadsheets, dashboards built on this foundation simply visualize the chaos rather than solving it. This fragmentation delays month-end close processes and erodes confidence in reported metrics.
The AI readiness gap compounds these challenges significantly. Without clean, governed data feeding your dashboards, adding AI capabilities becomes counterproductive. Many FP&A professionals cite lack of reliable data as their primary technology obstacle, preventing them from leveraging advanced analytics and forecasting features that could transform their workflows.
Manual processes persist even after dashboard implementation because teams don't trust automated outputs. Finance professionals spend hours validating dashboard numbers against their spreadsheets, defeating the purpose of automation. This creates a vicious cycle where dashboards become supplementary tools rather than primary decision-making platforms.
Common obstacles unique to mid-market companies include:
- Limited IT resources to maintain complex data pipelines feeding dashboards
- Budget constraints that force choices between comprehensive solutions and quick fixes
- Resistance from teams comfortable with Excel-based workflows they've used for years
- Lack of data engineering expertise to build robust integration between source systems
Pro Tip: Address dashboard failures by starting with one KPI everyone trusts, proving value with that single metric, then expanding gradually. This approach builds credibility and identifies data quality issues before they undermine broader adoption.
"The biggest mistake mid-market finance teams make is trying to automate everything at once without first establishing data governance and validation processes that ensure accuracy."
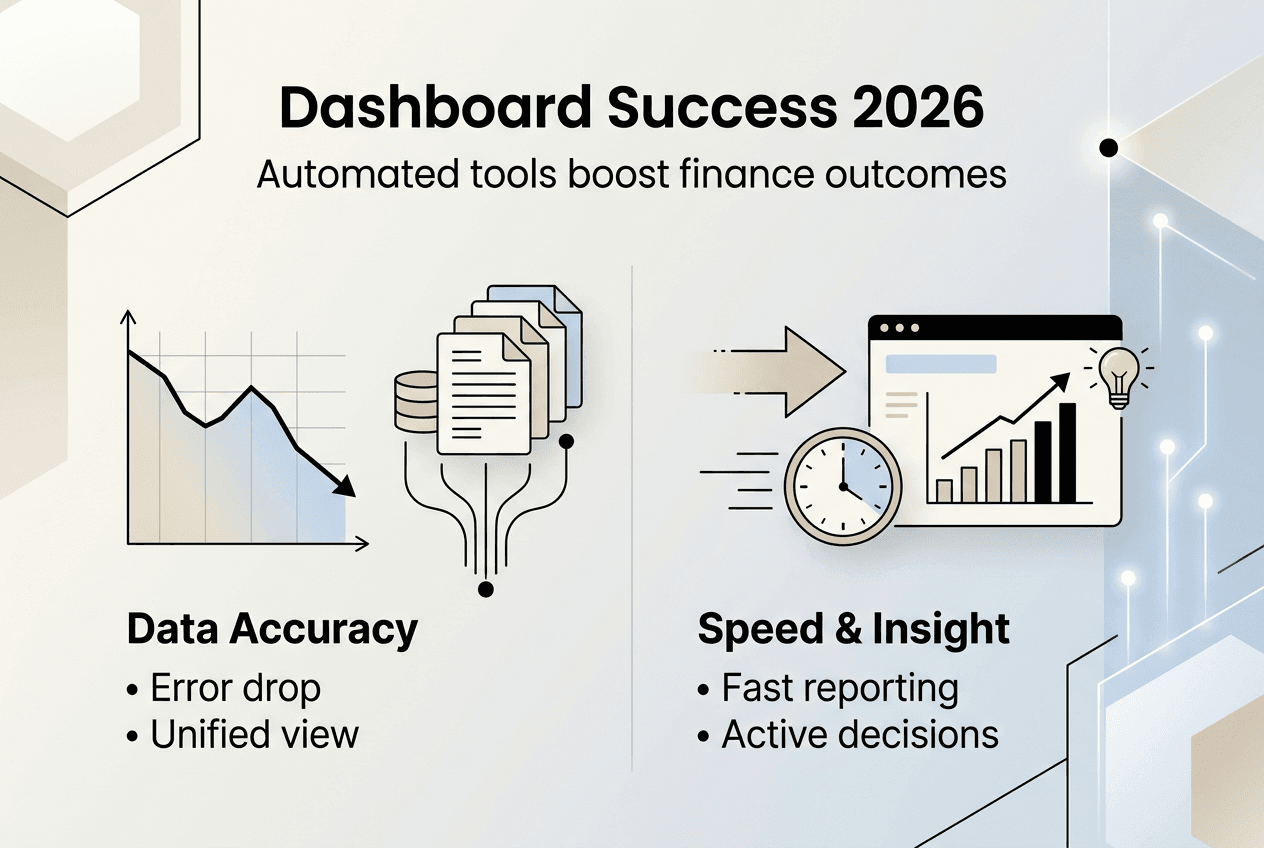
How automated dashboards enhance data accuracy and streamline reporting
Automated dashboards transform finance operations by consolidating disparate data sources into unified, real-time views that eliminate the reconciliation headaches plaguing manual reporting processes. The accuracy improvements stem from removing human touchpoints where errors typically occur.
Dashboards aggregate data automatically from your ERP, accounting software, CRM, and operational systems, applying consistent business logic and validation rules. Instead of finance analysts copying numbers between systems and spreadsheets, the dashboard pulls data directly from source systems through secure APIs and connectors. This direct integration means your cash flow, revenue recognition, and expense tracking update continuously without manual intervention.
Automated dashboards reduce data entry errors by up to 80% because they eliminate the copy-paste workflows where mistakes happen. When your month-end close requires manual consolidation of subsidiary financials, a single transposed digit can cascade into material misstatements. Automation removes this risk entirely by enforcing data type validation and business rule compliance at the integration layer.
Reporting speed improvements prove equally dramatic. Teams spending 40+ hours monthly on financial reporting can reduce that burden to near-zero through dashboard automation. Reporting cycles drop by up to 70% when you replace manual aggregation with automated data pipelines. Your board package that previously took two weeks to compile becomes available in real time.
Automated CFO dashboards pull real-time data from multiple sources into unified views, giving finance leaders instant visibility into metrics that previously required days of analysis. This speed advantage enables faster course corrections and more agile decision-making.
| Metric | Manual Reporting | Automated Dashboard |
|---|---|---|
| Data accuracy | 70-85% (high error rate) | 95-99% (validated at source) |
| Report generation time | 2-3 weeks monthly | Real-time or hours |
| Error correction effort | 15-20 hours per cycle | 2-3 hours per cycle |
| Data freshness | Days to weeks old | Current within minutes |
Key benefits that drive adoption include:
- Single source of truth eliminating version control issues across departments
- Automated variance analysis highlighting exceptions requiring attention
- Drill-down capabilities letting users investigate anomalies without analyst support
- Scheduled refresh cycles ensuring stakeholders always see current data
Pro Tip: Choose an implementation team that deeply understands your finance data's business context, not just the technical dashboard tools. The difference between a useful dashboard and shelf-ware often comes down to whether the builder understands revenue recognition timing, cost allocation logic, and your specific KPI definitions. Learn more about effective financial reporting automation in 2026.
Unlocking better decision-making with visual KPIs and scenario analysis
Visual KPIs transform dense financial data into intuitive charts and summaries that finance leaders can grasp instantly, accelerating the path from data to insight to action. The cognitive load reduction matters more than most teams realize.

When you present budget variance as a color-coded heatmap instead of a 50-row spreadsheet, executives immediately identify problem areas requiring attention. Visual dashboards translate metrics like days sales outstanding, gross margin trends, and cash runway into formats that non-finance stakeholders understand without explanation. This democratization of financial data improves cross-functional collaboration and alignment.
Scenario analysis capabilities separate truly valuable dashboards from basic reporting tools. Only 22% of organizations can run financial scenarios within a day, severely limiting their ability to model acquisition impacts, pricing changes, or market shifts before committing resources. Interactive dashboards with built-in scenario modeling let CFOs test assumptions and compare outcomes in minutes rather than waiting for FP&A to rebuild models.
Generative AI integration amplifies dashboard decision support significantly. 66% of finance leaders see generative AI impacting explanation of forecast and budget variances, helping teams understand why metrics moved and what actions to consider. AI-powered insights can automatically flag unusual patterns, suggest explanations based on historical data, and recommend next steps.
| Feature | Static Reports | Interactive Dashboards | AI-Enhanced Dashboards | | --- | --- | --- | | Insight generation | Manual analysis required | Self-service exploration | Automated anomaly detection | | Scenario modeling | Separate Excel models | Built-in what-if analysis | AI-suggested scenarios | | Variance explanation | Analyst writes commentary | Drill-down to root cause | Natural language explanations | | Decision speed | Days to weeks | Hours to days | Minutes to hours |
Practical applications that drive value include:
- Cash flow forecasting with sensitivity analysis for different collection scenarios
- Profitability analysis by customer segment revealing hidden loss leaders
- Headcount planning models showing break-even points for new hires
- Working capital optimization identifying inventory and receivables opportunities
Pro Tip: Prioritize dashboards that empower active decision support and collaboration, not just backward-looking reporting. The most valuable implementations let multiple stakeholders model scenarios together during planning sessions, testing assumptions in real time. Explore CFO KPI dashboard essentials and see how PE portfolio reporting leverages these capabilities.
Practical steps for mid-market finance teams to successfully implement automated dashboards
Successful dashboard adoption requires methodical planning and pragmatic execution rather than big-bang implementations that overwhelm teams and strain budgets. Follow this proven approach to maximize ROI and minimize risk.
-
Start with one critical KPI that everyone trusts and uses daily, such as cash position or revenue run rate. Prove value with tight guardrails before expanding to additional metrics. This focused approach lets you validate data quality, refine integration processes, and build user confidence without the complexity of a full dashboard suite.
-
Establish data governance and enterprise guardrails before scaling. Define data ownership, validation rules, and approval workflows for each metric. Document business logic for calculations so everyone understands how numbers are derived. Without governance, dashboards become sources of confusion rather than clarity.
-
Integrate pragmatically with existing ERPs and finance systems rather than pursuing perfect solutions that never launch. Success requires understanding data context and choosing the right implementation approach for your environment. Sometimes a well-designed connector beats a full data warehouse for mid-market needs.
-
Choose an experienced implementation team that understands finance workflows and data nuances. Technical dashboard skills matter less than domain expertise in revenue recognition, cost accounting, and financial close processes. The best implementations come from partners who ask about your chart of accounts structure and period-end procedures, not just which visualization tool you prefer.
-
Plan for change management and user engagement from day one. Schedule training sessions, create documentation, and designate dashboard champions in each department. Track adoption metrics and gather feedback to refine the dashboard iteratively. Technology succeeds or fails based on whether people actually use it.
-
Phase AI capabilities carefully after establishing reliable baseline reporting. Add predictive analytics and natural language querying only when your underlying data quality supports accurate AI outputs. Rushing AI integration without proper foundations leads to the high failure rates plaguing many implementations.
Pro Tip: Change management and user engagement drive adoption success more than technical features. Invest time in understanding how your team currently makes decisions and design dashboards that fit naturally into those workflows rather than forcing new processes. Consider professional dashboard development services to avoid common pitfalls, learn how to fix BI adoption challenges, and explore dashboard optimization consulting to maximize your investment.
Discover how Lole Works empowers finance leaders with automated dashboards
Mid-market finance teams need partners who understand the unique challenges of scaling reporting infrastructure without enterprise budgets or resources. Lole Works specializes in developing automated dashboards tailored specifically for finance leaders seeking to eliminate data silos, accelerate month-end close, and enable confident decision-making.
Our approach combines technical expertise in Power BI, Snowflake, and ERP integration with deep knowledge of finance workflows and data governance requirements. We help you move from fragmented spreadsheets to unified, trustworthy dashboards that your entire leadership team relies on daily. Whether you need BI dashboard development from scratch, data governance services to ensure accuracy, or comprehensive support across your analytics stack, we deliver solutions that fit your current state and scale with your growth. Explore our full range of reporting and BI services to see how we can transform your financial data infrastructure.
Frequently asked questions
What metrics should I start with when adopting automated dashboards?
Start with critical finance KPIs like cash flow, revenue, and expense ratios that directly impact decision-making and have clear business definitions everyone agrees on. Focus on metrics with reliable underlying data to ensure early success and build credibility. Avoid the temptation to automate everything at once, which often leads to data quality issues undermining the entire initiative.
How do automated dashboards improve data accuracy compared to traditional reporting?
Automation eliminates manual data entry, reducing errors by up to 80% through direct system integration and validation rules applied at the source. Centralized data models ensure consistency across ERP, accounting, and operational systems by enforcing uniform business logic. This eliminates the version control problems and reconciliation discrepancies that plague spreadsheet-based reporting.
What are the risks of poor AI integration with automated dashboards?
Without AI-ready data and enterprise guardrails, AI can introduce inaccuracies and cybersecurity risks that undermine trust in your entire analytics infrastructure. Poorly governed AI might generate plausible-sounding but factually incorrect variance explanations or forecasts. Pragmatic phased rollouts mitigate risk by building on proven, controlled deployments where you validate AI outputs against known results before expanding use cases.
How long does it typically take to implement an automated dashboard for finance?
A focused implementation starting with one or two KPIs typically takes four to eight weeks from kickoff to production use, depending on data source complexity and integration requirements. Comprehensive dashboard suites covering all finance functions may require three to six months for proper data modeling, governance setup, and user training. The key is balancing speed to value with building a sustainable foundation that scales.
Can automated dashboards integrate with our existing ERP and accounting systems?
Modern dashboard platforms offer robust connectors for virtually all major ERP systems, accounting software, and operational tools through APIs, database connections, or file-based integrations. The integration approach depends on your specific systems, data volumes, and real-time requirements. An experienced implementation partner can assess your environment and recommend the most reliable, maintainable integration architecture for your needs.